Measuring the Social ROI of Virtual Try-On (VTON)
VTON is increasingly used not only as a conversion tool, but as a powerful driver of social engagement and organic reach. When customers share their try-on results, each post becomes a micro-UGC moment that can generate impressions, clicks, and new shoppers — all without additional marketing spend. To understand its full value, brands need a simple, practical way to measure the social ROI of VTON. Below is a framework any fashion e-commerce team can use.
Share Rate: How Often Customers Post Their Try-Ons
This is the foundation of VTON’s social impact — how many shoppers actually share.
Share Rate = (Number of VTON Shares) / (Total VTON Sessions)
A strong share rate indicates:
- content feels personal enough to post
- try-on quality is high
- shoppers see social value in the output
Most brands track this across:
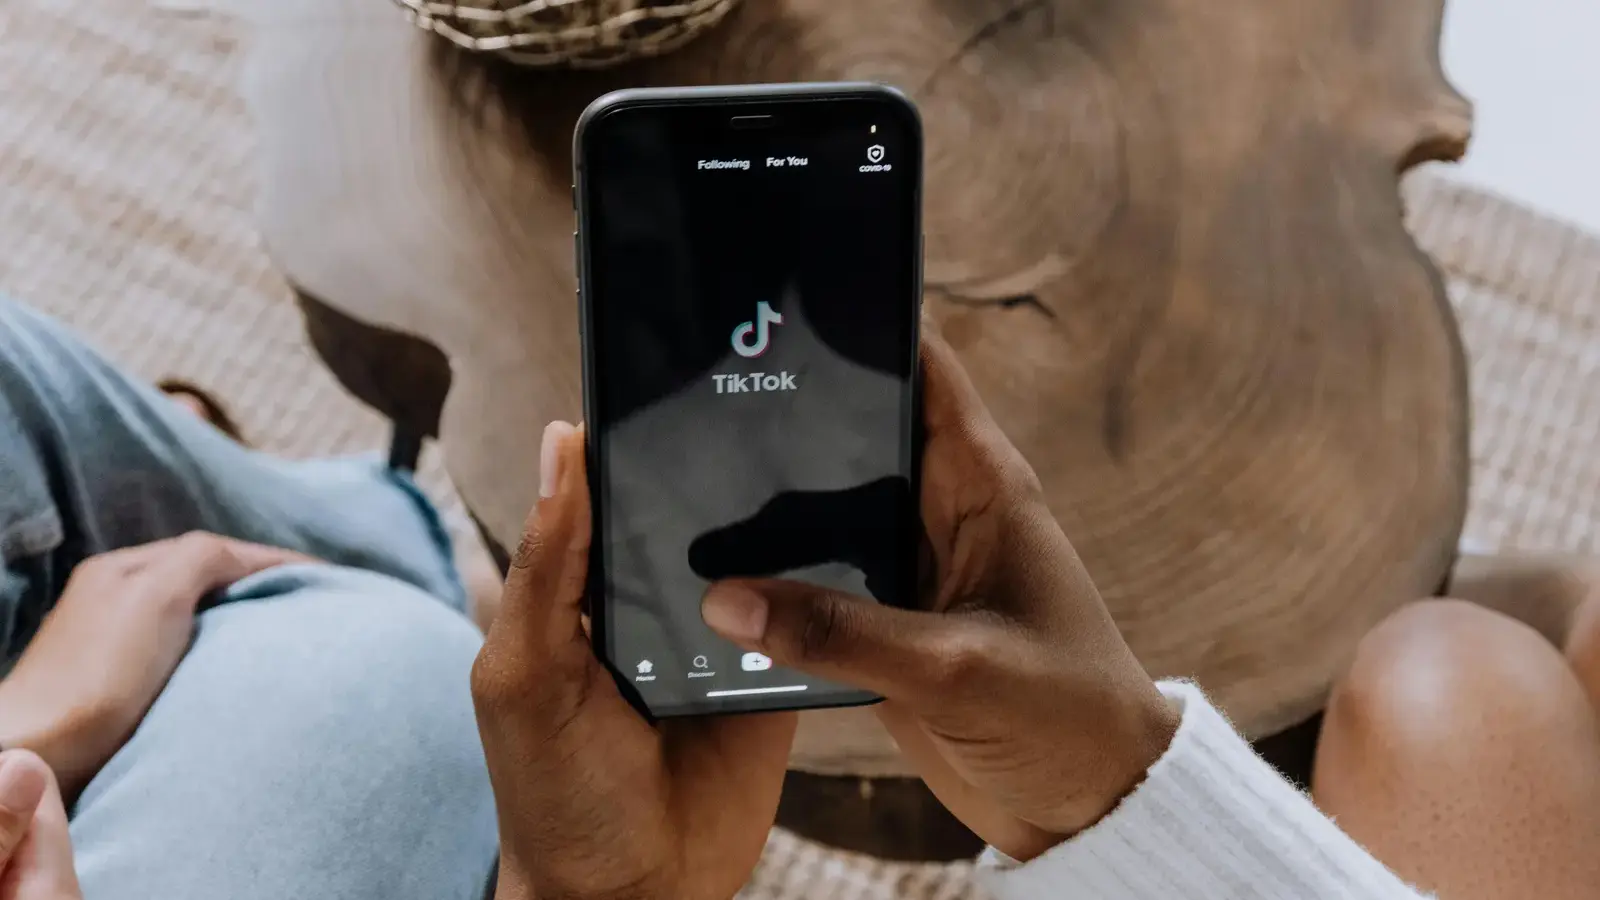
- Instagram Stories
- TikTok/Reels
- private chats (WhatsApp/Telegram)
- screenshots saved from the widget

Impressions Generated by Shared VTON Content
Each VTON share creates a wave of organic reach.
Impressions per Share = Total Views of Shared Try-On Content
This helps brands quantify:
- how far each customer post travels
- which platforms generate the highest visibility
- whether certain product categories get more traction
A single share from a highly engaged social group can generate hundreds or thousands of free impressions.
Engagement: Replies, Saves, Tags, and Reposts
VTON outputs behave like UGC, so they generate engagement that feels natural:
- friends reply or react
- users save the look
- they tag the brand for visibility
- they reshare to their own followers
High engagement signals that the VTON output feels authentic and visually appealing. UGC receives 5× more engagement than brand-created content.1
This multiplies the social ROI of every shared VTON moment.

Traffic Driven from Shared VTON Moments
Every viewer who clicks through represents measurable social traffic.
Traffic Metric = Sessions coming from VTON shared links or brand tags
This can be tracked through:
- link taps
- Instagram “View Shop” clicks
- TikTok profile taps
- tagged post activity
- website referral data
When VTON content travels, traffic follows — often at a lower cost than paid ads.
New VTON Sessions Triggered by a Share
The strongest proof of viral loop performance is when a shared try-on inspires someone else to try it.
VTON Viral Spread = New VTON Sessions Triggered by Shared Content
This metric shows how VTON content spreads naturally:
A tries on → A shares → B sees it → B tries on → B shares → C tries…
This is where organic reach compounds.
Conversions Influenced by VTON Shares
Some shoppers buy directly after seeing a friend’s try-on. Some buy after trying on themselves. Some buy after discovering the brand through a chain of shares.
You can measure:
- assisted conversions
- post-view conversions
- post-click conversions
- conversions after a VTON session
This ties the entire social loop to revenue, not just engagement.
Calculating Social ROI From VTON
Once the components are in place, calculating ROI becomes simple. Social ROI Formula:
Social ROI = (Value of Impressions + Engagement + Traffic + Conversions) – VTON Cost
Or in a more tangible format:
Social ROI = (Social Revenue + Organic Reach Value) / VTON Cost
Many brands measure organic reach value based on their CPM (cost per 1,000 impressions).
For example, if your usual CPM is $8 and VTON shares generate 300,000 free impressions, the value is:
300,000 impressions ÷ 1,000 × $8 = $2,400 in free reach
Now add traffic and conversions, and the ROI multiplies quickly.
Summary Insight
The social ROI of VTON is measurable and significant, compounding impressions, engagement, traffic, and conversions into a low-cost growth engine.
Turning Real Selfies Into Reliable Try-On Results
Hautech enables shoppers to generate photorealistic VTON images that look natural on social platforms. These outputs help brands unlock ongoing UGC, build organic visibility, and measure meaningful ROI across reach, engagement, and revenue.
Footnotes and References
Footnotes
-
Sprout Social — Social media statistics: https://sproutsocial.com/insights/social-media-statistics/ ↩